


[toc]
kubernetes 操作记录七
资源指标API及自定义指标API
资源指标: metrics-server
自定义指标: prometheus, k8s-prometheus-adapter
新一代架构:
核心指标流水线:由kubelet、metrics-server 以及由API server 提供的api组成;CPU、内存实时使用率、Pod的资源占用率及窗口的磁盘占用率;
监控流水线: 用于从系统收集各种指标数据并提供终端用户、存储系统以及HPA。它们包含核心指标及许多非核心指标。非核心指标本身不能被k8s所解析;
metrics-server: API server
部署 metrics-server
# mkdir metrics-server
# wget https://github.com/kubernetes-incubator/metrics-server/archive/v0.3.1.zip
# cd metrics-server/metrics-server-0.3.1/deploy/1.8+/
# mv * ../../../
问题修正
问题1:metrics-server默认使用节点hostname通过kubelet 10250端口获取数据,但是coredns里面没有该数据无法解析(10.96.0.10:53),可以在metrics server启动命令添加参数 —kubelet-preferred-address-types=InternalIP 直接使用节点IP地址获取数据
问题2:kubelet 的10250端口使用的是https协议,连接需要验证tls证书。可以在metrics server启动命令添加参数—kubelet-insecure-tls不验证客户端证书
问题3:yaml文件中的image地址k8s.gcr.io/metrics-server-amd64:v0.3.0 需要梯子,需要改成中国可以访问的image地址,可以使用aliyun的
registry.cn-hangzhou.aliyuncs.com/google_containers/
修改以下内容
 containers:
      - name: metrics-server
        #image: k8s.gcr.io/metrics-server-amd64:v0.3.0
        image: registry.cn-hangzhou.aliyuncs.com/google_containers/metrics-server-amd64:v0.3.0
        imagePullPolicy: IfNotPresent
        command:
        - /metrics-server
        - --metric-resolution=30s
        - --kubelet-insecure-tls
        - --kubelet-preferred-address-types=InternalIP,Hostname,InternalDNS,ExternalDNS,ExternalIP
        volumeMounts:
        - name: tmp-dir
          mountPath: /tmp
# kubectl api-versions | grep metrics
metrics.k8s.io/v1beta1
# curl  http://localhost:8080/apis/metrics.k8s.io/v1beta1
{
  "kind": "APIResourceList",
  "apiVersion": "v1",
  "groupVersion": "metrics.k8s.io/v1beta1",
  "resources": [
    {
      "name": "nodes",
      "singularName": "",
      "namespaced": false,
      "kind": "NodeMetrics",
      "verbs": [
        "get",
        "list"
      ]
    },
    {
      "name": "pods",
      "singularName": "",
      "namespaced": true,
      "kind": "PodMetrics",
      "verbs": [
        "get",
        "list"
      ]
    }
  ]
}
错误日志排查
# kubectl logs -f metrics-server-68cdb458db-rgjtr -c metrics-server -n kube-system
主要提供node 和Pod的监控数据;
kubectl  top nodes
NAME                   CPU(cores)   CPU%   MEMORY(bytes)   MEMORY%
node01                  94m          4%     1574Mi          42%
node02                  92m          4%     1901Mi          51%
node03                  108m         5%     1803Mi          48%
master                  238m         11%    1879Mi          50%
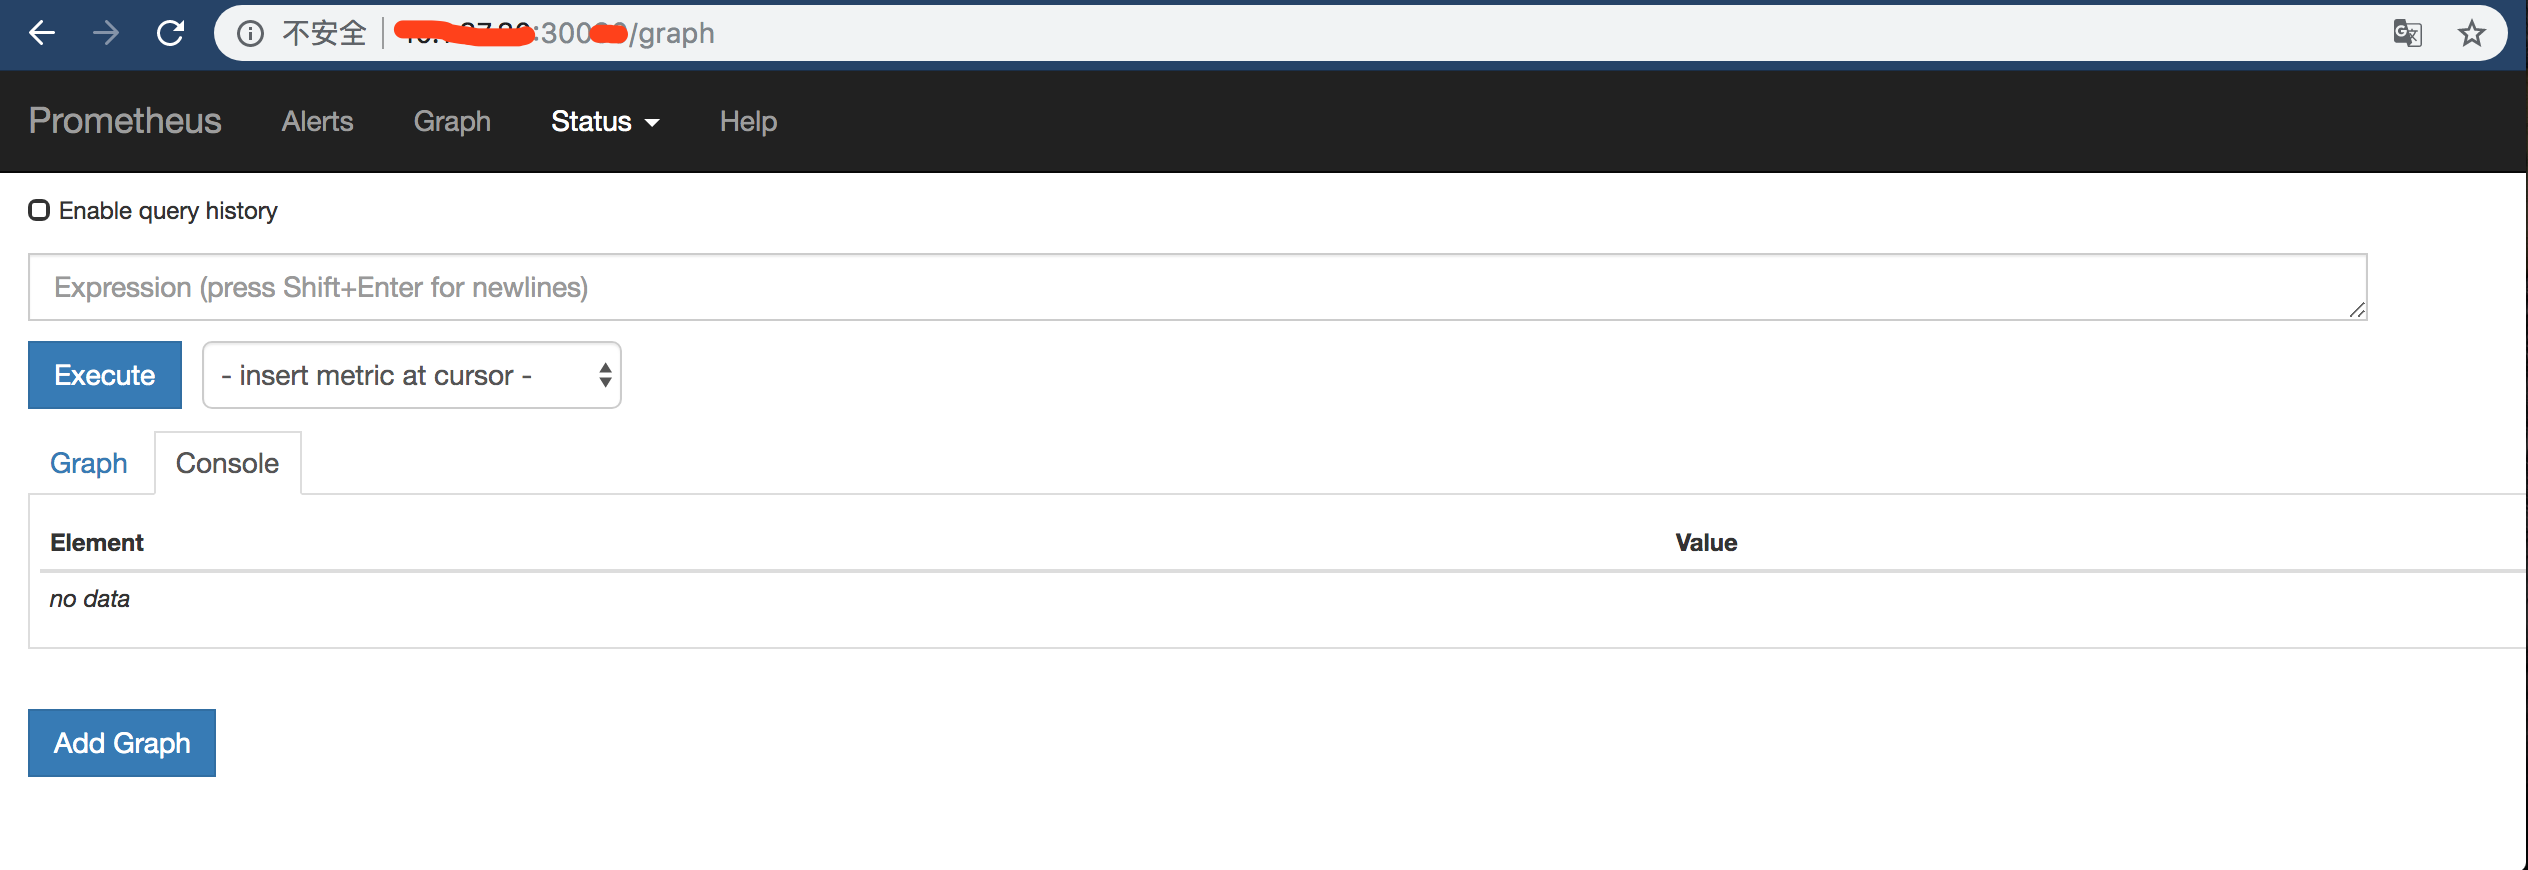
prometheus 部署
# git clone https://github.com/iKubernetes/k8s-prom.git
# cd k8s-prom
# kubectl  apply -f namespace.yaml
# cd node_exporter/
# kubectl  apply -f ./
# kubectl get pods -n prom
NAME                             READY   STATUS    RESTARTS   AGE
prometheus-node-exporter-2xrqp   1/1     Running   0          47s
prometheus-node-exporter-cgkp7   1/1     Running   0          47s
prometheus-node-exporter-t7vh7   1/1     Running   0          47s
prometheus-node-exporter-vrw89   1/1     Running   0          46s
# cd ../prometheus/
# kubectl apply -f ./
注: 在生产环境中,至少要用pv存储,不然当Pod删除时,数据也会被删除;
安装 kube-state-metrics
# cd ../kube-state-metrics/
# vim kube-state-metrics-deploy.yaml # 修改image镜像源
image: quay.io/coreos/kube-state-metrics:v1.3.1
# kubectl  apply -f ./
# kubectl  get all -n prom
安装 k8s-prometheus-adapter
# /etc/kubernetes/pki/
# (umask 077; openssl genrsa -out serving.key 2048)
# openssl req -new -key serving.key -out serving.csr -subj "/CN=serving"
# openssl x509 -req -in serving.csr  -CA ./ca.crt -CAkey ./ca.key -CAcreateserial -out serving.crt -days 36500
# kubectl create generic cm-adapter-serving-certs --from-file=serving.crt --from-file=serving.key
# kubectl create secret  generic cm-adapter-serving-certs --from-file=serving.crt --from-file=serving.key -n prom
# cd manifests/metrics/k8s-prom/k8s-prometheus-adapter
# kubectl apply -f ./
发现k8s-prometheus-adapter中的custom-metrics-apiserver-deployment.yaml 配置变了,这里可以根据原有内容 image: directxman12/k8s-prometheus-adapter-amd64 google搜索directxman12更新
# mv custom-metrics-apiserver-deployment.yaml{,.bak}
# wget https://raw.githubusercontent.com/DirectXMan12/k8s-prometheus-adapter/master/deploy/manifests/custom-metrics-apiserver-deployment.yaml
# vim custom-metrics-apiserver-deployment.yaml # 改namespace: prom
# wget https://raw.githubusercontent.com/DirectXMan12/k8s-prometheus-adapter/master/deploy/manifests/custom-metrics-config-map.yaml
# vim custom-metrics-config-map.yaml  # 改namespace: prom
# kubectl  get all -n prom
NAME                                            READY   STATUS    RESTARTS   AGE
pod/custom-metrics-apiserver-667fd4fffd-qs2zk   1/1     Running   0          3m18s
pod/kube-state-metrics-6697d66bbb-w7k4d         1/1     Running   0          20m
pod/prometheus-node-exporter-2xrqp              1/1     Running   0          71m
pod/prometheus-node-exporter-cgkp7              1/1     Running   0          71m
pod/prometheus-node-exporter-t7vh7              1/1     Running   0          71m
pod/prometheus-node-exporter-vrw89              1/1     Running   0          71m
pod/prometheus-server-75cf46bdbc-kpgzs          1/1     Running   0          69m
补充kubelet 启动失败 swapoff -a
新入新节点时卡住 kubeadm token create kubeadm token list
# curl http://localhost:8080/apis/custom.metrics.k8s.io/v1beta1
安装 grafana
改原grafana 配置文件
apiVersion: apps/v1
kind: Deployment
metadata:
  name: monitoring-grafana
  namespace: prom
spec:
  replicas: 1
  selector:
    matchLabels:
      task: monitoring
      k8s-app: grafana
  template:
    metadata:
      labels:
        task: monitoring
        k8s-app: grafana
    spec:
      containers:
      - name: grafana
        image: registry.cn-hangzhou.aliyuncs.com/google_containers/heapster-grafana-amd64:v5.0.4
        ports:
        - containerPort: 3000
          protocol: TCP
        volumeMounts:
        - mountPath: /etc/ssl/certs
          name: ca-certificates
          readOnly: true
        - mountPath: /var
          name: grafana-storage
        env:
        #- name: INFLUXDB_HOST
        #  value: monitoring-influxdb
        - name: GF_SERVER_HTTP_PORT
          value: "3000"
          # The following env variables are required to make Grafana accessible via
          # the kubernetes api-server proxy. On production clusters, we recommend
          # removing these env variables, setup auth for grafana, and expose the grafana
          # service using a LoadBalancer or a public IP.
        - name: GF_AUTH_BASIC_ENABLED
          value: "false"
        - name: GF_AUTH_ANONYMOUS_ENABLED
          value: "true"
        - name: GF_AUTH_ANONYMOUS_ORG_ROLE
          value: Admin
        - name: GF_SERVER_ROOT_URL
          # If you're only using the API Server proxy, set this value instead:
          # value: /api/v1/namespaces/kube-system/services/monitoring-grafana/proxy
          value: /
      volumes:
      - name: ca-certificates
        hostPath:
          path: /etc/ssl/certs
      - name: grafana-storage
        emptyDir: {}
---
apiVersion: v1
kind: Service
metadata:
  labels:
    # For use as a Cluster add-on (https://github.com/kubernetes/kubernetes/tree/master/cluster/addons)
    # If you are NOT using this as an addon, you should comment out this line.
    kubernetes.io/cluster-service: 'true'
    kubernetes.io/name: monitoring-grafana
  name: monitoring-grafana
  namespace: prom
spec:
  # In a production setup, we recommend accessing Grafana through an external Loadbalancer
  # or through a public IP.
  # type: LoadBalancer
  # You could also use NodePort to expose the service at a randomly-generated port
  # type: NodePort
  type: NodePort
  ports:
  - port: 80
    targetPort: 3000
    nodePort: 30098
    protocol: TCP
  selector:
    k8s-app: grafana
# kubectl apply -f grafana.yaml
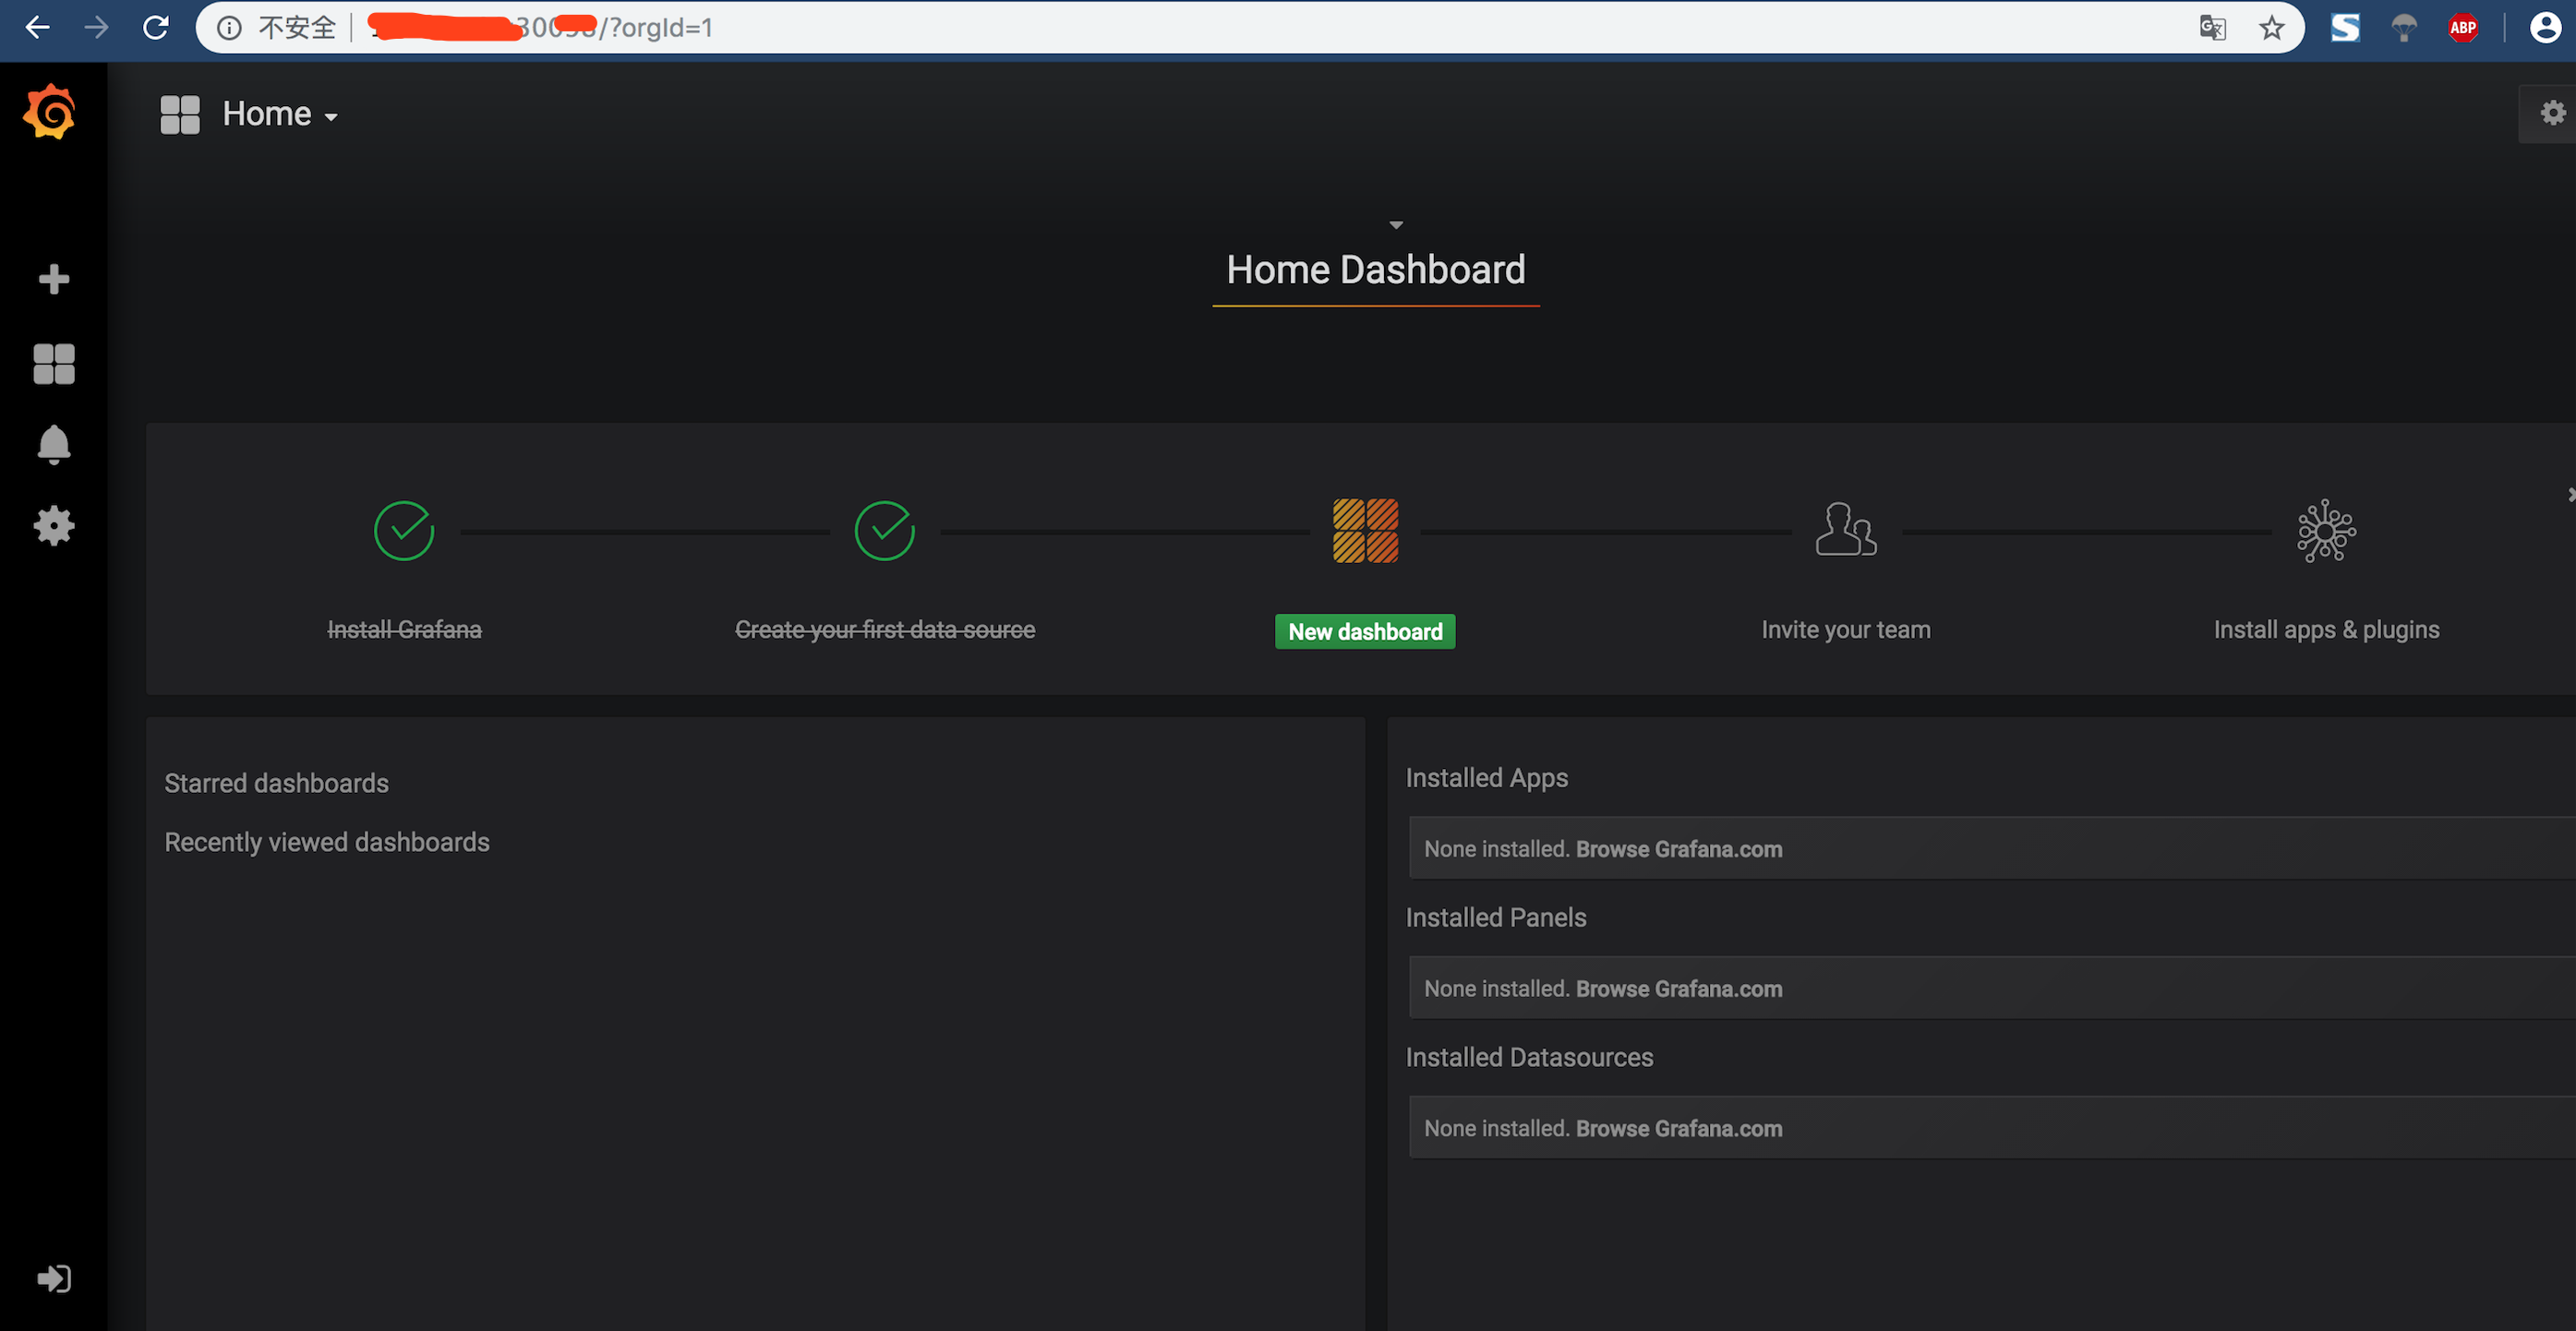
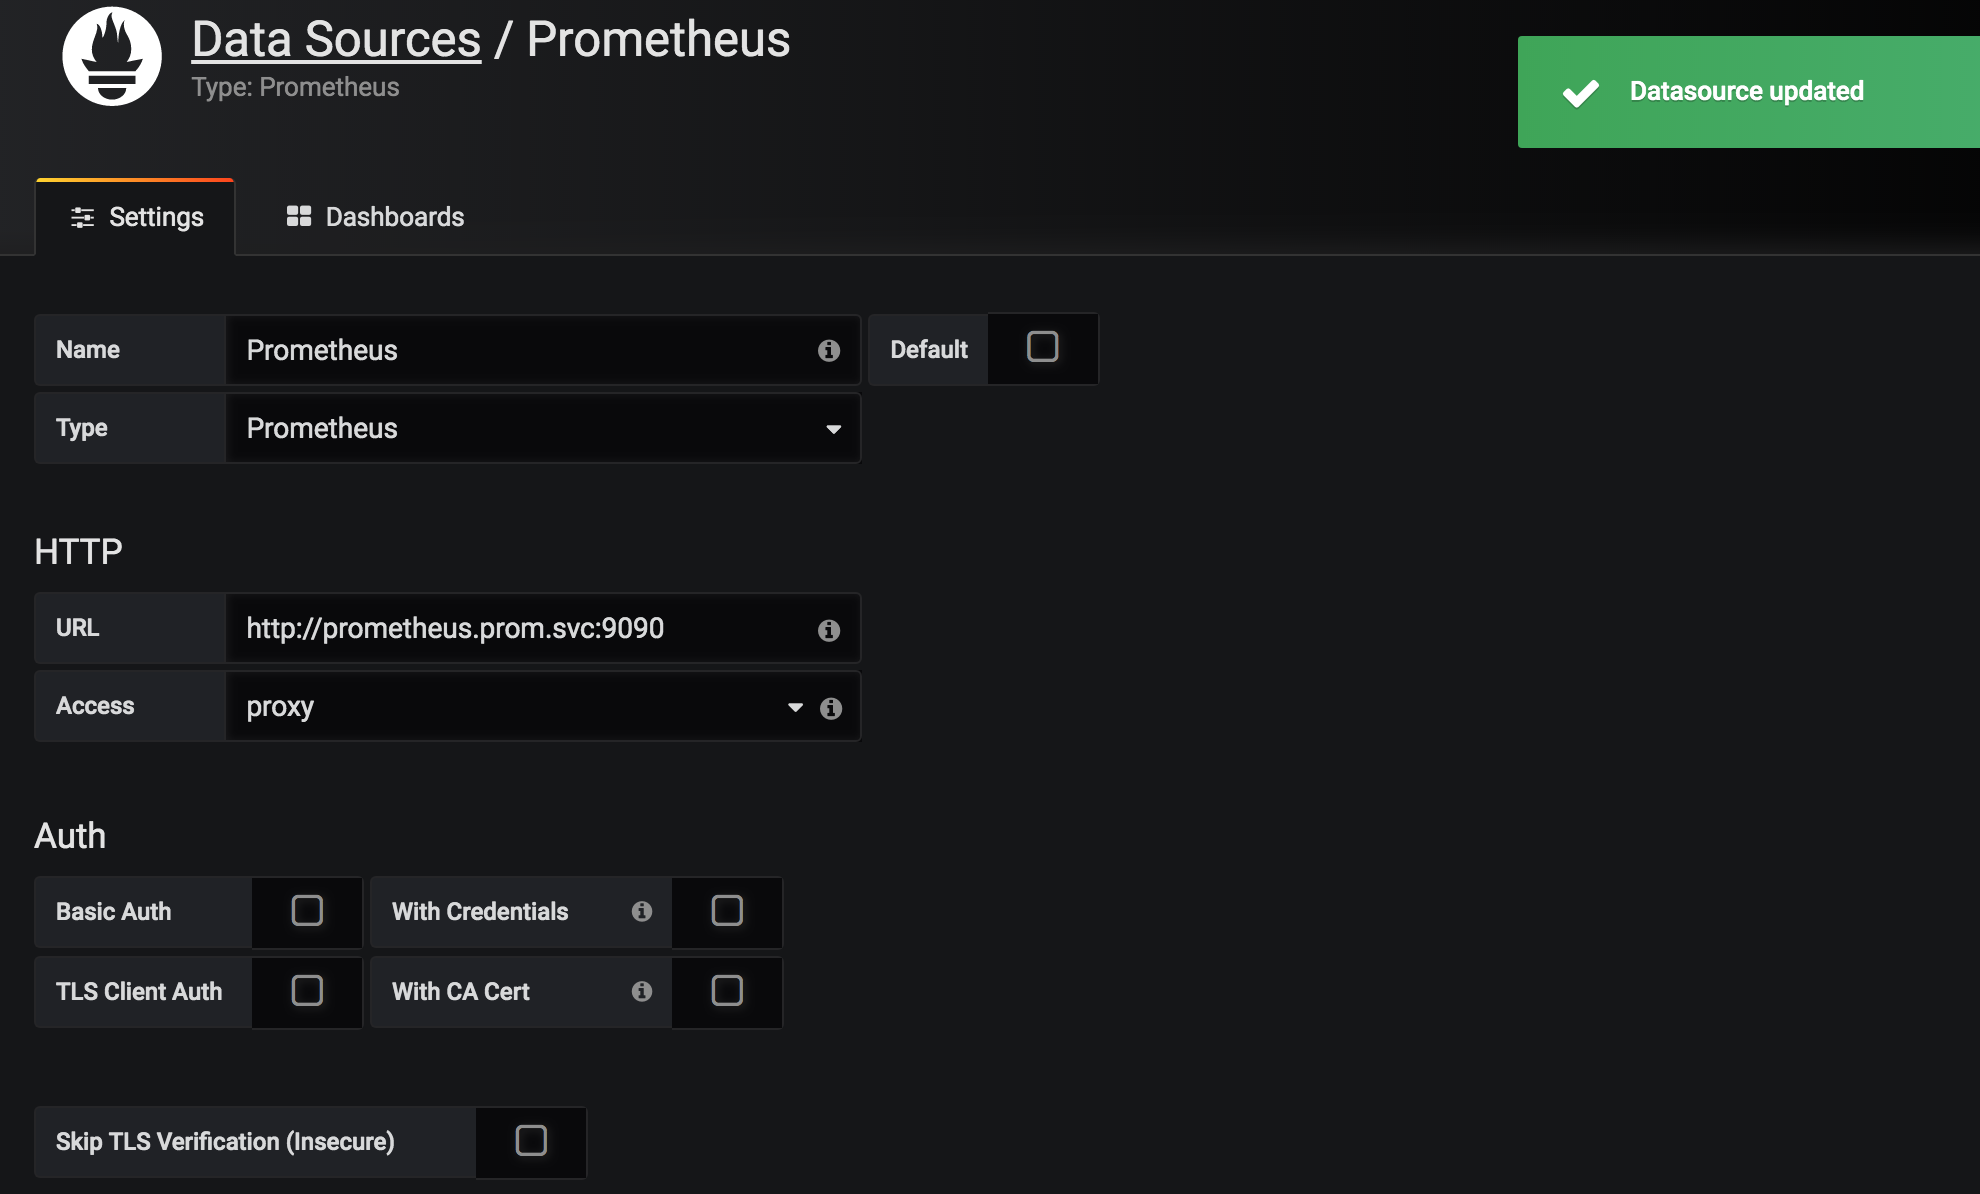
下载并导入模版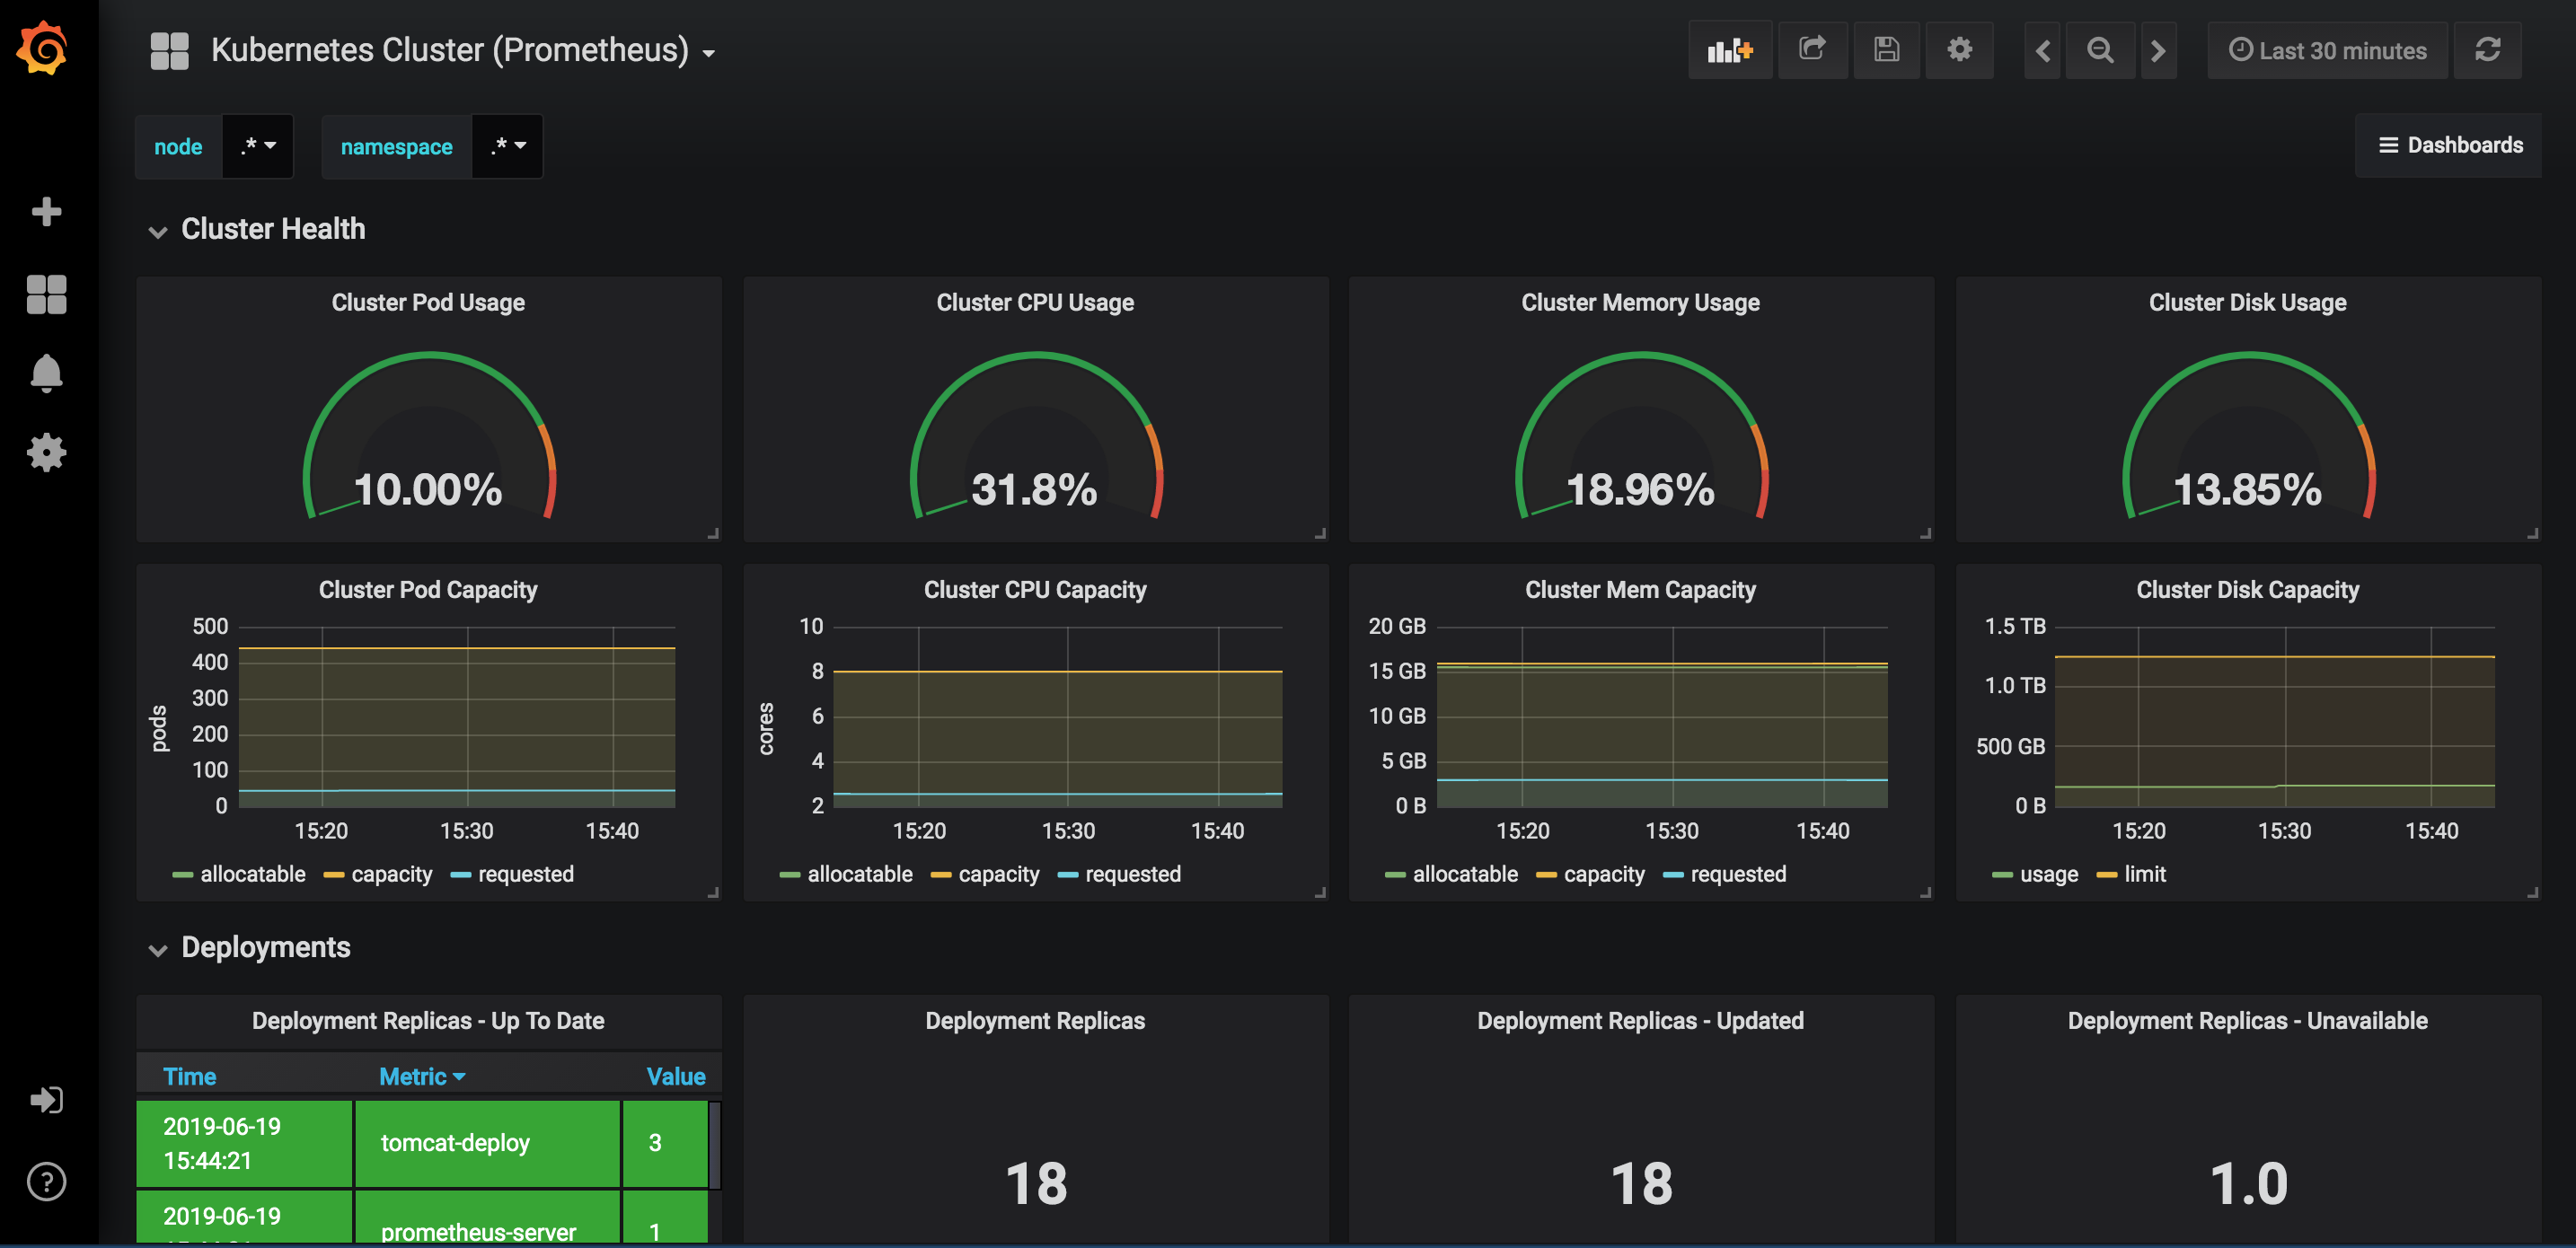
资源限制与伸缩
# kubectl run myapp --image=ikubernetes/myapp:v1 --replicas=0 --requests='cpu=50m,memory=256Mi' --limits='cpu=50m,memory=256Mi' --labels='app=myapp' --expose --port=80
# kubectl autoscale deployment myapp --min=1 --max=8 --cpu-percent=60
horizontalpodautoscaler.autoscaling/myapp autoscaled
#  kubectl get hpa
NAME    REFERENCE          TARGETS   MINPODS   MAXPODS   REPLICAS   AGE
myapp   Deployment/myapp   0%/60%    1         8         1          22s
# kubectl patch svc myapp -p '{"spec":{"type": "NodePort"}}'
service/myapp patched
#ssjinyao ➤ ab -c 100 -n 50000 http://xx.x.xx.xx:31257/index.html
当压测,CPU 内存资源超出时,会扩展Pod数目
apiVersion: autoscaling/v2beta1
kind: HorizontalPodAutoscaler
metadata:
  name: myapp-hpa-v2
spec:
  scaleTargetRef:
    apiVersion: apps/v1
    kind: Deployment
    name: myapp
  minReplicas: 1
  maxReplicas: 10
  metrics:
  - type: Resource
    resource:
      name: cpu
      targetAverageUtilization: 55
  - type: Resource
    resource:
      name: memory
      targetAverageValue: 50Mi
根据请求数升Pod数
apiVersion: autoscaling/v2beta1
kind: HorizontalPodAutoscaler
metadata:
  name: myapp-hpa-v2
spec:
  scaleTargetRef:
    apiVersion: apps/v1
    kind: Deployment
    name: myapp
  minReplicas: 1
  maxReplicas: 10
  metrics:
  - type: Pods
    pods:
      metricName: http_requests
      targetAverageValue: 800m
helm 入门
核心术语:
Chart: 一个helm程序包;
Repository: Charts仓库,https/http服务器;
Release:特定的Chart部署于目标集群上的一个实例;
Chart -> Config -> Release
程序架构:
helm:客户端,管理本地的Chart仓库,管理Chart,与Tiller服务器交互,发送Chart,实例安装、查询、卸载等操作
Tiller: 服务端 ,接收helm发来的Chart与Config,合并生成release;
helm github官网
安装helm
# wget https://get.helm.sh/helm-v2.9.1-linux-amd64.tar.gz
# mv linux-amd64/helm  /usr/sbin/
# helm
要使用helm 还需要安装 Tiller
helm 会识别 .kube/config 扮演成kubectl 客户端去连接至kubernetes集群
安装 Tiller
# mkdir helm
# cd helm/
# vim tiller-rbac.yaml
apiVersion: v1
kind: ServiceAccount
metadata:
  name: tiller
  namespace: kube-system
---
apiVersion: rbac.authorization.k8s.io/v1
kind: ClusterRoleBinding
metadata:
  name: tiller
roleRef:
  apiGroup: rbac.authorization.k8s.io
  kind: ClusterRole
  name: cluster-admin
subjects:
  - kind: ServiceAccount
    name: tiller
    namespace: kube-system
# kubectl apply -f tiller-rbac.yaml
# helm init --service-account tiller
报错与处理
# helm init --service-account tiller
Creating /root/.helm
Creating /root/.helm/repository
Creating /root/.helm/repository/cache
Creating /root/.helm/repository/local
Creating /root/.helm/plugins
Creating /root/.helm/starters
Creating /root/.helm/cache/archive
Creating /root/.helm/repository/repositories.yaml
Adding stable repo with URL: https://kubernetes-charts.storage.googleapis.com
Error: Looks like "https://kubernetes-charts.storage.googleapis.com" is not a valid chart repository or cannot be reached: Get https://kubernetes-charts.storage.googleapis.com/index.yaml: read tcp 10.1.87.80:41084->172.217.163.240:443: read: connection reset by peer
添加国内源
# helm init --client-only --stable-repo-url https://kubernetes.oss-cn-hangzhou.aliyuncs.com/charts
如果报如下错误,请按照下面解决
Error: Couldn't load repositories file (/home/docker/.helm/repository/repositories.yaml).
You might need to run `helm init` (or `helm init --client-only` if tiller is already installed)
解决办法
helm init --client-only --stable-repo-url https://kubernetes.oss-cn-hangzhou.aliyuncs.com/charts
–stable-repo-url 指定下载软件从那个源下载,默认的是从google下载,国内下载不下来,所以我们指定源为阿里云的源。
下载完之后我们还把源更换回来,要不然后面会报错
# helm repo add rancher-stable https://releases.rancher.com/server-charts/stable
# helm init --service-account tiller --tiller-image \
registry.cn-hangzhou.aliyuncs.com/google_containers/tiller:v2.12.3 \
--stable-repo-url https://kubernetes.oss-cn-hangzhou.aliyuncs.com/charts
更新 helm 源
# helm repo update
Hang tight while we grab the latest from your chart repositories...
...Skip local chart repository
...Successfully got an update from the "stable" chart repository
...Successfully got an update from the "rancher-stable" chart repository
Update Complete. ⎈ Happy Helming!⎈
helm 官方可用的Chart列表
# helm search jenkins  # 搜索应用
# helm inspect stable/jenkins  # 查看使用配置信息
# helm install --name mem1 stable/memcached # 安装Memcached
# kubectl get pods --namespace default -l "app=mem1-memcached" -o jsonpath="{.items[0].metadata.name}" mem1-memcached-0 #验证
helm 常用命令
release 管理
insstall
delete
upgrade/rollback
list
history
status 获取release 状态信息
chart 管理
crate
fetch
get
inspect
package
verify
chart get 到本地路径 /root/.helm/cache/archive
根据自定义变量创建
# helm install --name redis1 -f values.yaml stable/redis
# helm status redis1 # 再次显示NOTES
部署EFK 日志系统
部署elasticsearch
EFK: Fluentd
在容器集群岩调,再接入Pod查询日志是不可能的,所以必要的有一个统一的日志收集系统;
一个完整的kubernetes系统应该有:kubedns or coredns ,ingress-contraler,heapster or metracs server prometheus , dashboard 。而EFK是一个kubernetes基本上需要提供的完整组件;
添加helm源
# helm repo add extra https://burdenbear.github.io/kube-charts-mirror/
# helm repo add stable http://mirror.azure.cn/kubernetes/charts/
# helm repo add incubator http://mirror.azure.cn/kubernetes/charts-incubator/
#  helm fetch stable/elasticsearch
# helm fetch stable/fluentd-elasticsearch
#  helm fetch stable/kibana
# tar -xvf elasticsearch-1.28.5.tgz
#  tar -xvf fluentd-elasticsearch-2.0.7.tgz
#  tar -xvf kibana-3.1.0.tgz
# cd elasticsearch
#  vim values.yaml # 修改以下内容
  pullPolicy: "IfNotPresent"
    persistence:
    enabled: false
# kubectl create namespace efk
# helm package elasticsearch/
# 新开启一个终端
# helm serve
Regenerating index. This may take a moment.
Now serving you on 127.0.0.1:8879

# helm install --name els1 --namespace=efk  local/elasticsearch
测试
# kubectl run cirror-$RANDOM --rm -it --image=cirros -- /bin/sh
/ # nslookup els1-elasticsearch-client.efk.svc
Server:    10.96.0.10
Address 1: 10.96.0.10 kube-dns.kube-system.svc.cluster.local

Name:      els1-elasticsearch-client.efk.svc
Address 1: 10.111.159.57 els1-elasticsearch-client.efk.svc.cluster.local
curl els1-elasticsearch-client.efk.svc.cluster.local:9200
{
  "name" : "els1-elasticsearch-client-787568fb55-9zd9k",
  "cluster_name" : "elasticsearch",
  "cluster_uuid" : "_na_",
  "version" : {
    "number" : "6.4.3",
    "build_flavor" : "default",
    "build_type" : "tar",
    "build_hash" : "fe40335",
    "build_date" : "2018-10-30T23:17:19.084789Z",
    "build_snapshot" : false,
    "lucene_version" : "7.4.0",
    "minimum_wire_compatibility_version" : "5.6.0",
    "minimum_index_compatibility_version" : "5.0.0"
  },
  "tagline" : "You Know, for Search"
}
/ # curl els1-elasticsearch-client.efk.svc.cluster.local:9200/_cat/nodes
10.244.1.215 15 90 7 0.12 0.36 0.35 di - els1-elasticsearch-data-1
10.244.2.132 19 60 2 0.09 0.23 0.19 di - els1-elasticsearch-data-0
10.244.1.213 22 90 7 0.12 0.36 0.35 i  - els1-elasticsearch-client-787568fb55-9zd9k
10.244.2.131 26 60 2 0.09 0.23 0.19 i  - els1-elasticsearch-client-787568fb55-sxhhp
10.244.1.214 44 90 7 0.12 0.36 0.35 mi * els1-elasticsearch-master-0
部署 fluentd
# cd fluentd-elasticsearch/
# vim values.yaml
image:
  repository: registry.cn-hangzhou.aliyuncs.com/google_containers/fluentd-elasticsearch
elasticsearch:
  host: 'els1-elasticsearch-client.efk.svc.cluster.local'
  port: 9200
  scheme: 'http'
  ssl_version: TLSv1_2
  buffer_chunk_limit: 2M
  buffer_queue_limit: 8
  logstash_prefix: 'logstash'
tolerations:
   - key: node-role.kubernetes.io/master
     operator: Exists
     effect: NoSchedule
podAnnotations:
   prometheus.io/scrape: "true"
   prometheus.io/port: "24231"
service:
   type: ClusterIP
   ports:
     - name: "monitor-agent"
       port: 24231
# helm package ../fluentd-elasticsearch/
# helm install --name flu1 --namespace=efk local/fluentd-elasticsearch
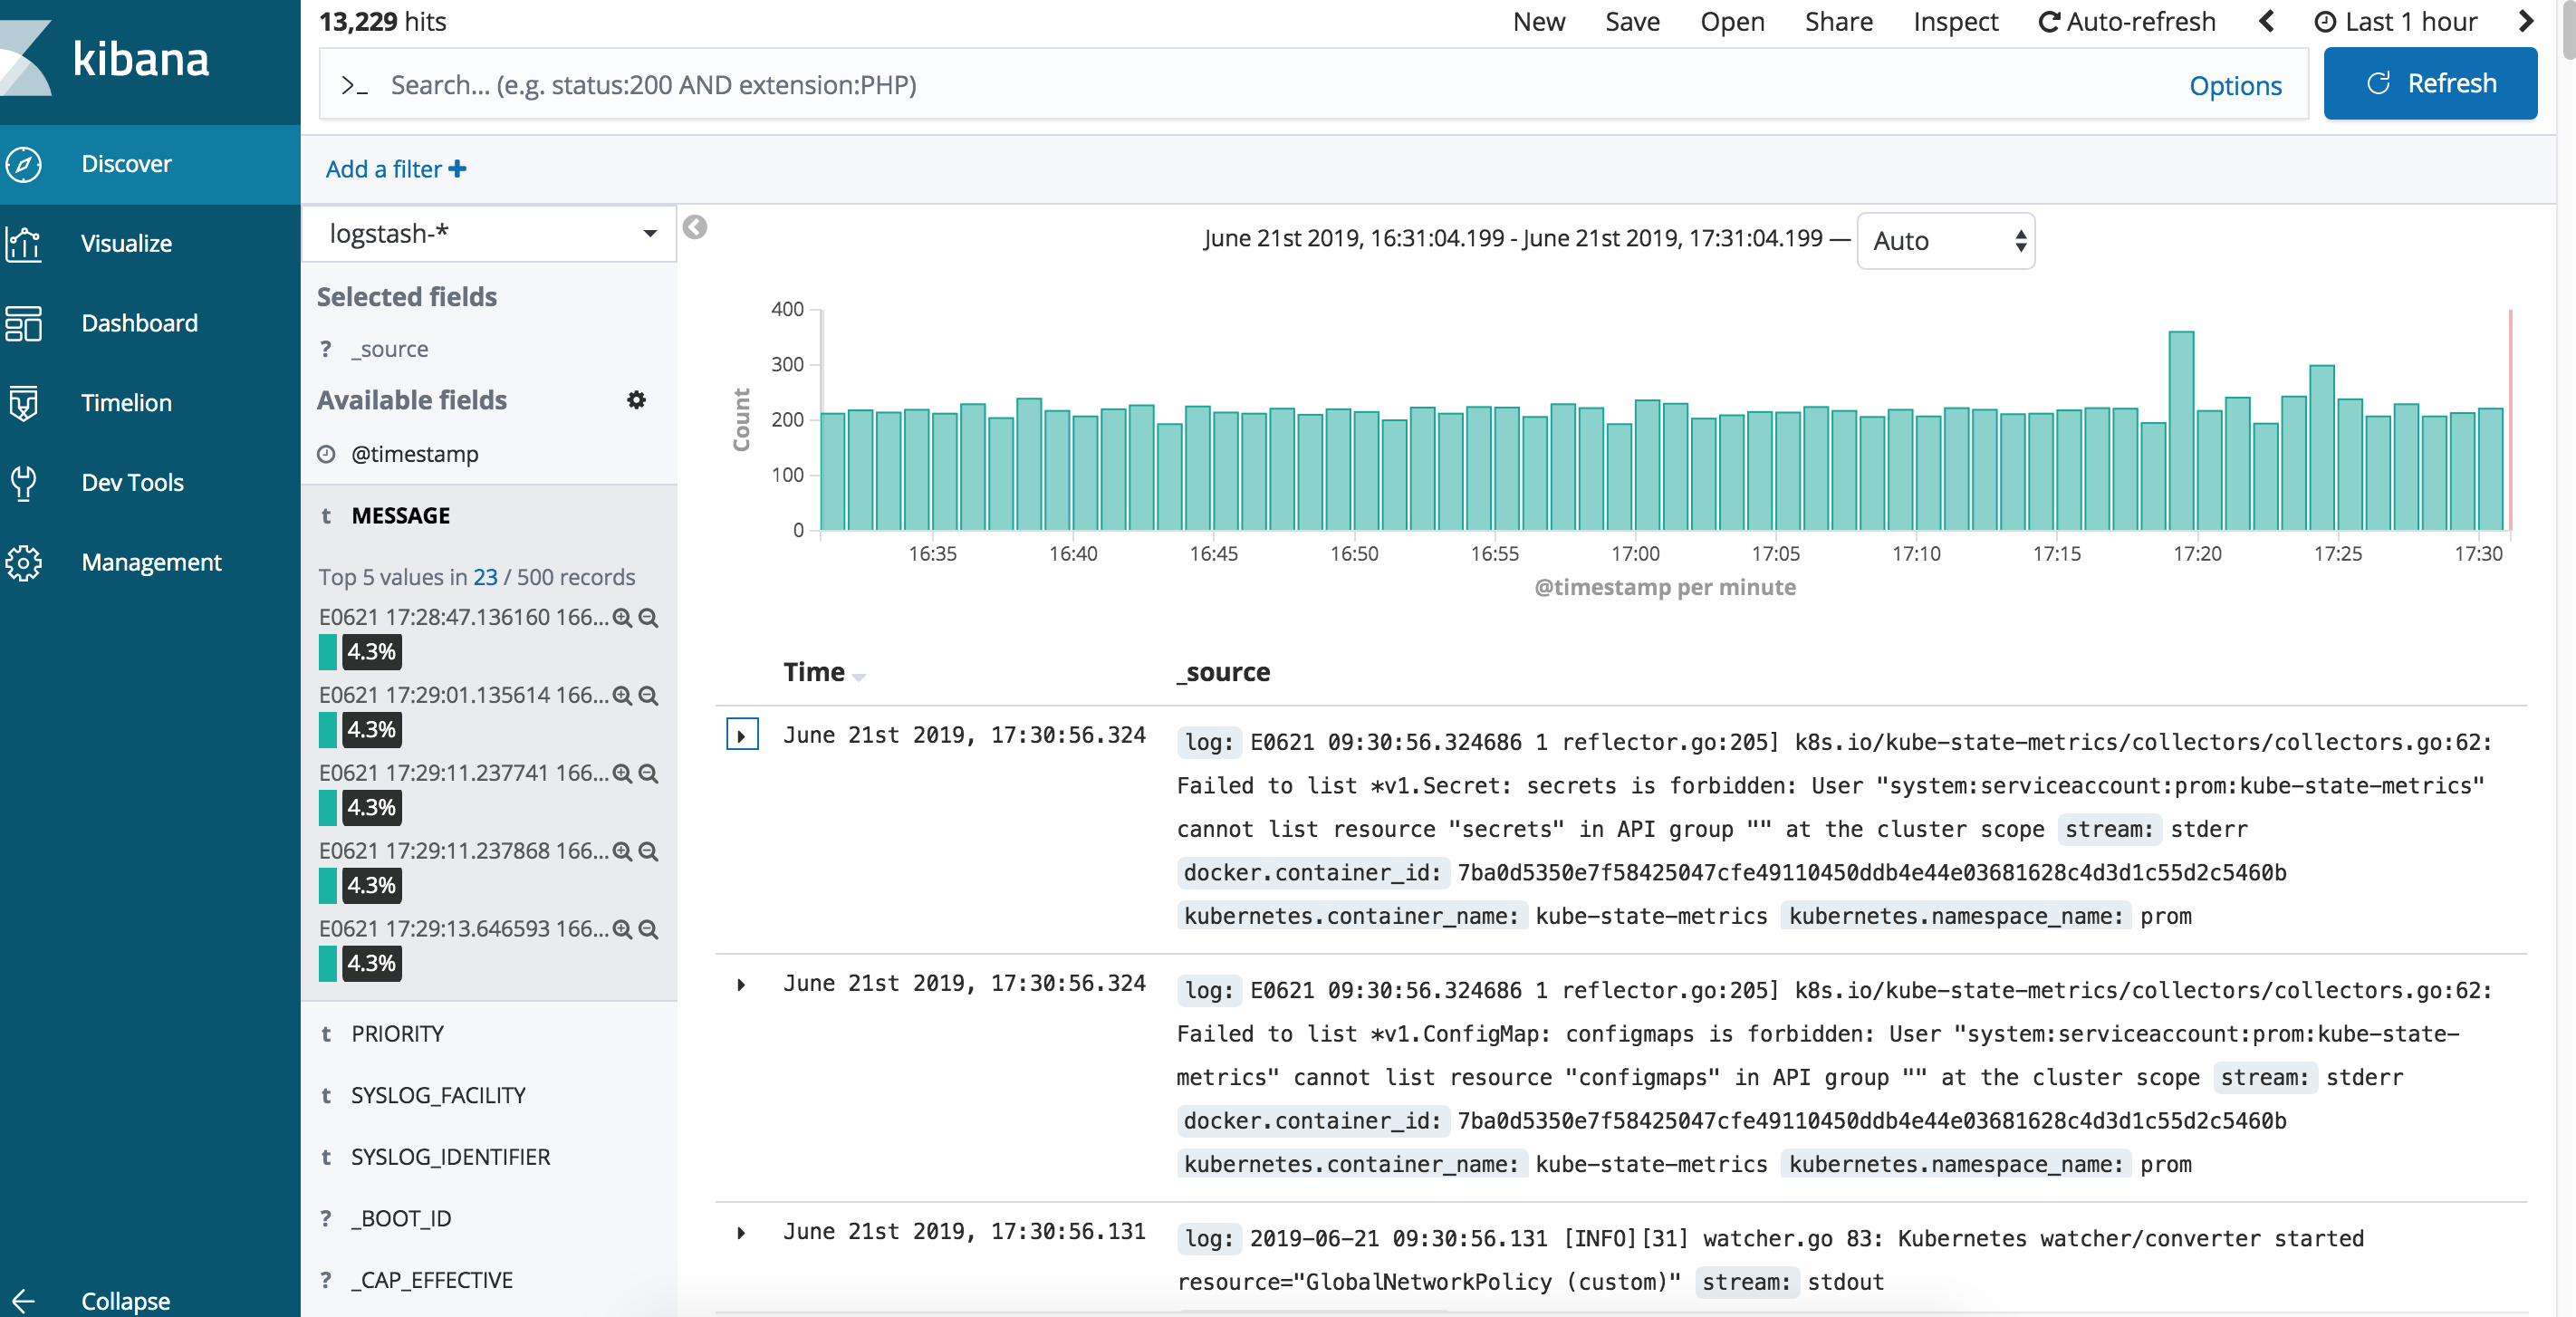
安装 kibana
# cd kibana
# vim values.yaml # 修改以下内容
    elasticsearch.hosts: http://els1-elasticsearch-client.efk.svc.cluster.local:9200
    service:
  type: NodePort
# helm package ../kibana/
# helm  install --name kibana1 --namespace=efk local/kibana
# kubectl get pods -n efk
NAME                                         READY   STATUS    RESTARTS   AGE
els1-elasticsearch-client-6b4b8c7485-7grbt   1/1     Running   0          96m
els1-elasticsearch-client-6b4b8c7485-sqgtl   1/1     Running   0          96m
els1-elasticsearch-data-0                    1/1     Running   0          96m
els1-elasticsearch-data-1                    1/1     Running   0          78m
els1-elasticsearch-master-0                  1/1     Running   0          96m
els1-elasticsearch-master-1                  1/1     Running   0          93m
els1-elasticsearch-master-2                  1/1     Running   0          78m
flu1-fluentd-elasticsearch-95b95             1/1     Running   0          26m
flu1-fluentd-elasticsearch-vpcsg             1/1     Running   0          26m
flu1-fluentd-elasticsearch-w5wjj             1/1     Running   0          26m
flu1-fluentd-elasticsearch-xkpv2             1/1     Running   0          26m
kibana1-5dcf5f5d47-rsmqb                     1/1     Running   0          21m
# kubectl  get svc -n efk
NAME                           TYPE        CLUSTER-IP    EXTERNAL-IP   PORT(S)         AGE
els1-elasticsearch-client      ClusterIP   10.98.8.75    <none>        9200/TCP        97m
els1-elasticsearch-discovery   ClusterIP   None          <none>        9300/TCP        97m
kibana1                        NodePort    10.96.230.3   <none>        443:31746/TCP   21m
docker pull 报错信息总结
error pulling image configuration
# echo "DOCKER_OPTS=\"\$DOCKER_OPTS --registry-mirror=http://f2d6cb40.m.daocloud.io\"" | tee -a /etc/default/docker
# 或者 vim /etc/default/docker 更改以下信息
DOCKER_OPTS="${DOCKER_OPTS} --registry-mirror=https://mirror.gcr.io"
# systemctl restart docker
配置并访问kibana