


[toc]
CentOS 7 ELK(Elasticsearch Logstash Kibana) 搭建
不管是用于记录,监控或者程序的Debug,日志,对于任何系统来说都是一个及其重要的部分;
但一般日志的数据量会比较大,并且分散在各个地方。如果管理的服务器或者程序比较少的情况;
我们还可以逐一登录到各个服务器去查看,分析。但如果服务器或者程序的数量比较多了;
之后这种方法就显得力不从心。基于此,一些集中式的日志系统也就应用而生;
目前比较有名成熟的有,Sentry、Splunk(商业)、FaceBook 的Scribe、Apache 的 Chukwa;
Cloudera 的 Fluentd、还有ELK 等等;
Sentry 与 ELK的对比
1、 sentry
sentry 是由python开发且开源的日志存储工具,占用内存较小,执行速度较慢,适合少量日志存储;
php python等程序可以直接调用sentry url 将日志写入,不支持sentry主动去额外的收集日志;
不支持分布式与横向扩展;
只能查找错误日志,不支持全局搜索;
一般运行在docker中,部署方便。出现问题排查费劲;
最底配置1核1G;
2、 ELK
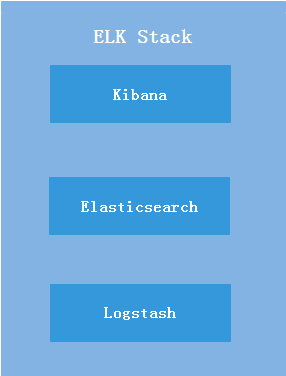
ELK即(Elasticsearch[搜索引擎],Logstash[日志收集],Kibana [客户端接入的web平台]);
ELK 是由JAVA开发且开源的日志存储套件,占用内存较大,执行速度较快,适合大量志日志高并发存储;
支持分存式与横向扩展;
支持全局搜索,支持正则表达式搜索,支持图形统计, 支持日志json、表格形式;
一般运行在系统层面,部署费劲。出现问题易于拆分,排查;
最底配置2核4G;
此次部署过程
- 注: 二进制包Elasticsearch 不能用root用户启动服务
JDK 8 的安装与配置
# useradd  elasticsearch
# passwd elasticsearch
# vim /etc/profile #在最后加入以下内容
export JAVA_HOME=/usr/lib/jvm/java-1.8.0-openjdk-1.8.0.161-0.b14.el7_4.x86_64
export JRE_HOME=/usr/lib/jvm/java-1.8.0-openjdk-1.8.0.161-0.b14.el7_4.x86_64/jre
export PATH=/usr/share/logstash/bin/:$PATH

# source /etc/profile
# yum -y install yum -y install java
[root@iz8vbap8o8nj8n6yoc05n6z logstash-5.3.0]# java -version
openjdk version "1.8.0_161"
OpenJDK Runtime Environment (build 1.8.0_161-b14)
OpenJDK 64-Bit Server VM (build 25.161-b14, mixed mode)
[root@iz8vbap8o8nj8n6yoc05n6z logstash-5.3.0]# echo $JAVA_HOME
/usr/lib/jvm/java-1.8.0-openjdk-1.8.0.161-0.b14.el7_4.x86_64
ElasticSearch 安装与配置
1、安装 ElasticSearch
# wget https://artifacts.elastic.co/downloads/elasticsearch/elasticsearch-5.3.0.zip

# unzip elasticsearch-5.3.0.zip
# mv elasticsearch-5.3.0 /usr/local/
# chown elasticsearch.elasticsearch /usr/local/elasticsearch-5.3.0/ -R
# vim /usr/local/elasticsearch-5.3.0/config/elasticsearch.yml #启用变更以下配置

cluster.name: transfereasy-elk
node.master: true
node.data: true
path.data: /data/elasticData

path.logs: /data/logs
network.host: 0.0.0.0
http.port: 9200
2、安装x-pack插件
# /usr/local/elasticsearch-5.3.0/bin/elasticsearch-plugin install x-pack
3、启动 ElasticSearch
# su - elasticsearch
$ /usr/local/elasticsearch-5.3.0/bin/elasticsearch -d
$ exit

# 服务启动验证
# netstat -tnlup | egrep "9200|9300"
tcp        0      0 0.0.0.0:9200            0.0.0.0:*               LISTEN      14459/java
tcp        0      0 0.0.0.0:9300            0.0.0.0:*               LISTEN      14459/java
4、api 验证
# curl http://localhost:9200 -u elastic
# 默认用户 elastic 默认密码:changeme
{
  "name" : "RXHIrkw",
  "cluster_name" : "ssjinyao-elk",
  "cluster_uuid" : "xxxxxxxxxxxxxxxxxx",
  "version" : {
    "number" : "5.3.0",
    "build_hash" : "3adb13b",
    "build_date" : "2017-03-23T03:31:50.652Z",
    "build_snapshot" : false,
    "lucene_version" : "6.4.1"
  },
  "tagline" : "You Know, for Search"
}
5、添加开机启动
echo "/usr/local/elasticsearch-5.3.0/bin/elasticsearch -d" > /etc/rc.local
6、问题解决
a、can not run elasticsearch as root # 需新建启动ElasticSearch的用户
b、max file descriptors [65535] for elasticsearch process is too low, increase to at least [65536]
# vim /etc/sercurity/limits.conf
* soft nofile 655350
* hard nofile 655350
$ su - elasticsearch # 再次合对是否可以打开655350个文件
c、max virtual memory areas vm.max_map_count [65530] is too low, increase to at least [262144]
# vim /etc/sysctl.conf 添加以下内容
vm.max_map_count=655300
# sysctl -p
Kibana的安装与配置
1、 安装
# wget https://artifacts.elastic.co/downloads/kibana/kibana-5.3.0-linux-x86_64.tar.gz
# tar -zxf kibana-5.3.0-linux-x86_64.tar.gz
# mv kibana-5.3.0-linux-x86_64 /usr/local/
# chown elasticsearch.elasticsearch /usr/local/kibana-5.3.0-linux-x86_64/ -R
# cd /usr/local/kibana-5.3.0-linux-x86_64/
# bin/kibana-plugin  install x-pack
2、 配置
# vim /usr/local/kibana-5.3.0-linux-x86_64/config/kibana.yml  # 变更以下配置
elasticsearch.url: "http://localhost:9200"

# su - elasticsearch
$ nohup /usr/local/kibana-5.3.0-linux-x86_64/bin/kibana &
# exit
# netstat  -tnlup | grep 5601
tcp        0      0 127.0.0.1:5601          0.0.0.0:*               LISTEN      14132/node
Nginx 的安装与配置
# yum install nginx -y
# nginx -t
# vim /etc/nginx/conf.d/kibana.conf
server {
    listen       80 default_server;
    listen       [::]:80 default_server;
    server_name _;
    location / {
        proxy_pass http://127.0.0.1:5601;
        proxy_http_version 1.1;
        proxy_set_header Upgrade $http_upgrade;
        proxy_set_header Connection 'upgrade';
        proxy_set_header Host $host;
        proxy_cache_bypass $http_upgrade;
    }
}
# vim /etc/nginx/nginx.conf  注释默认虚拟主机
#    server {
#        listen       80 default_server;
#        listen       [::]:80 default_server;
#        server_name  _;
#        root         /usr/share/nginx/html;
#
#        # Load configuration files for the default server block.
#        include /etc/nginx/default.d/*.conf;
#
#        location / {
#        }
#
#        error_page 404 /404.html;
#            location = /40x.html {
#        }
#
#        error_page 500 502 503 504 /50x.html;
#            location = /50x.html {
#        }
#    }

# nginx -t
# systemctl restart nginx
浏览器访问 http://xxx.ssjinyao.com/

Logstash 的安装与配置
- 注:由于logstash-5.3的二进制包无法实别系统环境PASH变量,所以这里用rpm包,yum安装
1、 下载并安装Logstash rpm 包
# wget https://artifacts.elastic.co/downloads/logstash/logstash-6.1.2.rpm
# yum -y install logstash-6.1.2.rpm
2、 配置Logstash 收集远程日志
# vim first-pipeline.conf
input {
  udp {
    port => 5959
    codec => json
  }
}
filter {
    grok {
        match => { "message" => "%{COMBINEDAPACHELOG}"}
    }
    geoip {
        source => "clientip"
    }
}
output {
    #stdout { codec => rubydebug }
    elasticsearch {
        hosts => ["127.0.0.1:9200"]
        user => "elastic"
        password => "xxxxxxxxx"
  }
}
# logstash -f first-pipeline.conf --path.settings=/etc/logstash/ --config.reload.automatic &
beats 的安装与配置
Beats是作为代理在服务器上安装的开源的 data shippers,能将各种不同类型的操作数据;
(如, wireData、LogFiles、Metrics、WinEvent)直接发送到 Elasticsearch;
或者通过Logstash将其发送到Elasticsearch。我们可以使用它来解析和转换我们需要收集的各种数据;
1、 安装
# wget https://artifacts.elastic.co/downloads/beats/metricbeat/metricbeat-5.3.1-x86_64.rpm
# yum -y install  metricbeat-5.3.1-x86_64.rpm
2、 配置
# vim /etc/metricbeat/metricbeat.yml
metricbeat.modules:
- module: system
  metricsets:
    - cpu
    - load
    - core
    - diskio
    - filesystem
    - fsstat
    - memory
    - network
    - process
    - socket
  enabled: true
  period: 10s
  processes: ['.*']
- module: nginx
  metricsets: ["stubstatus"]
  enabled: true
  period: 10s
  hosts: ["http://127.0.0.1"]
  server_status_path: "NginxStatus"
output.elasticsearch:
  hosts: ["127.0.0.1:9200"]
  username: "elastic"
  password: "changeme"
logging.level: debug
output.elasticsearch:
  hosts: ["localhost:9200"]
# metricbeat.sh -c metricbeat.yml  -configtest
Config OK
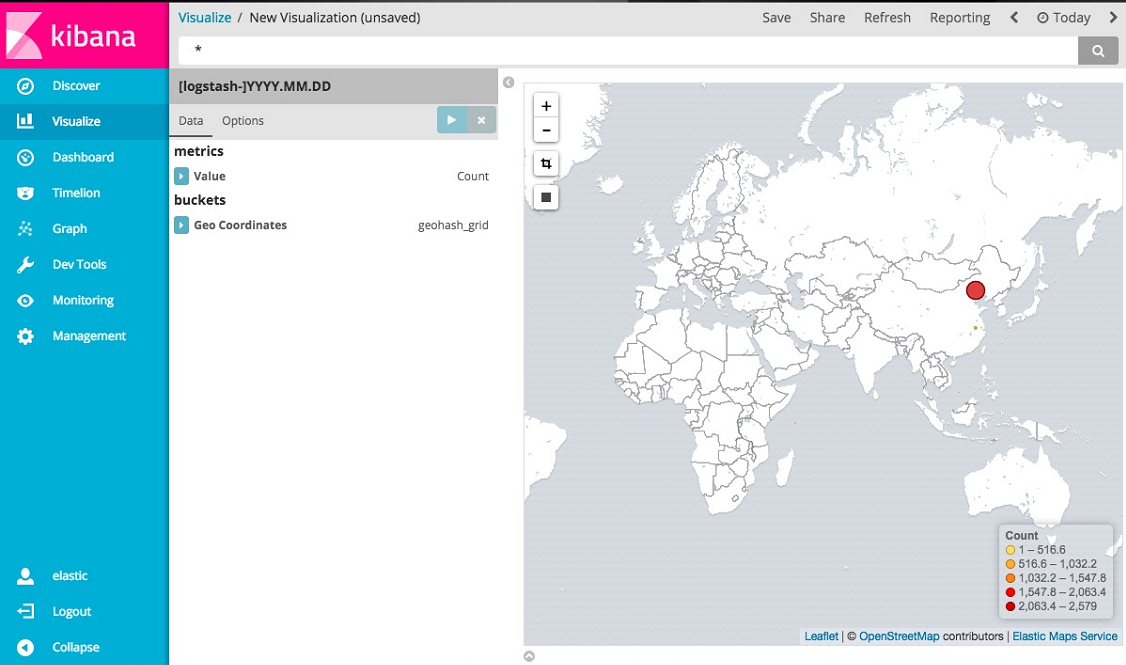
登录查询日志
1、 相看日志源ip区域分布
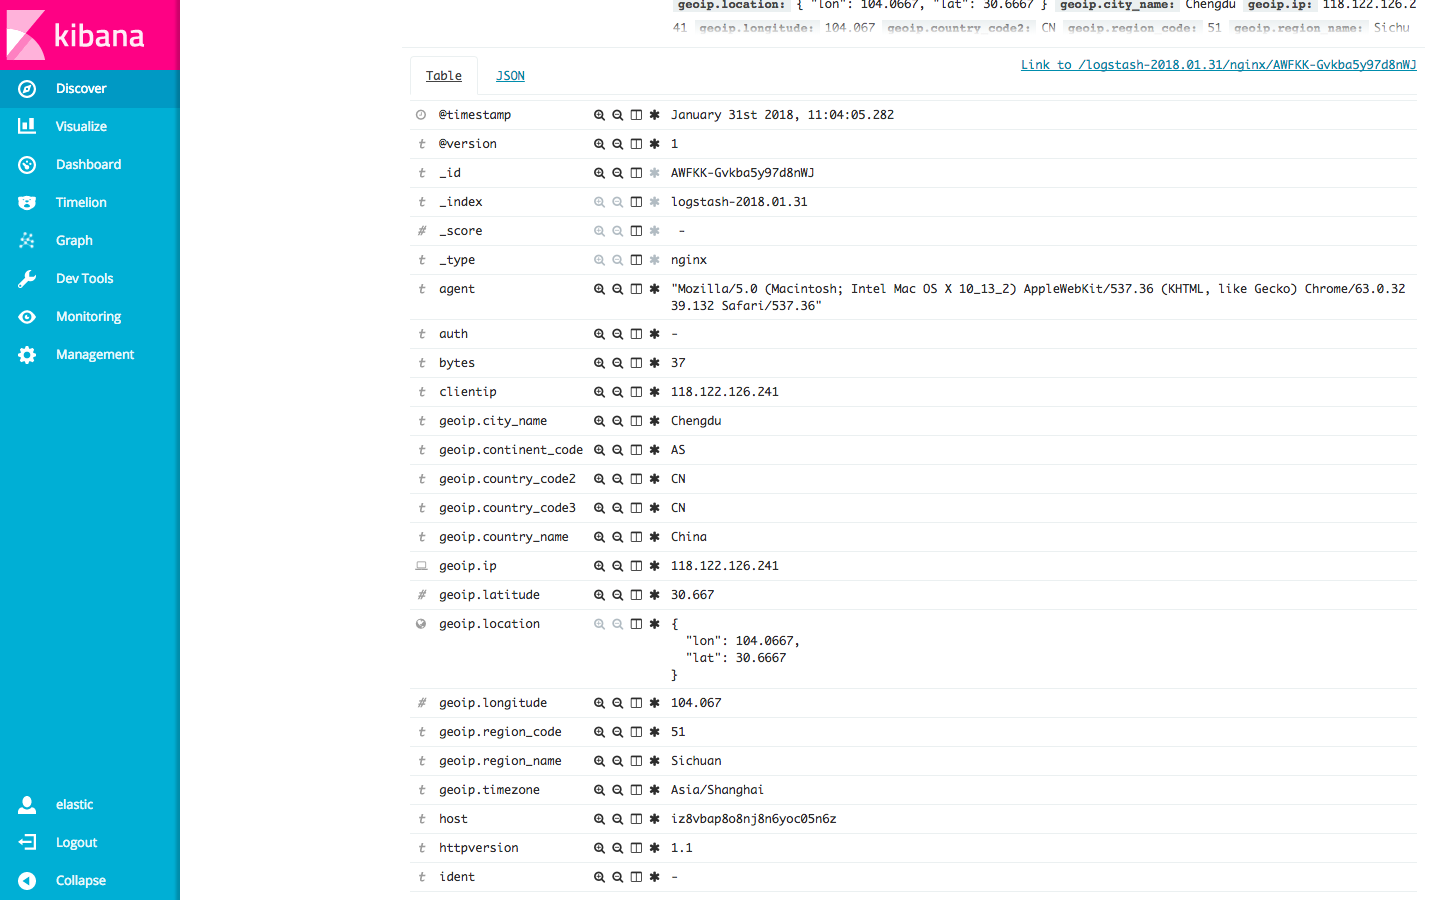
2、 Nginx 日志格式如下
3、 使用正则搜索
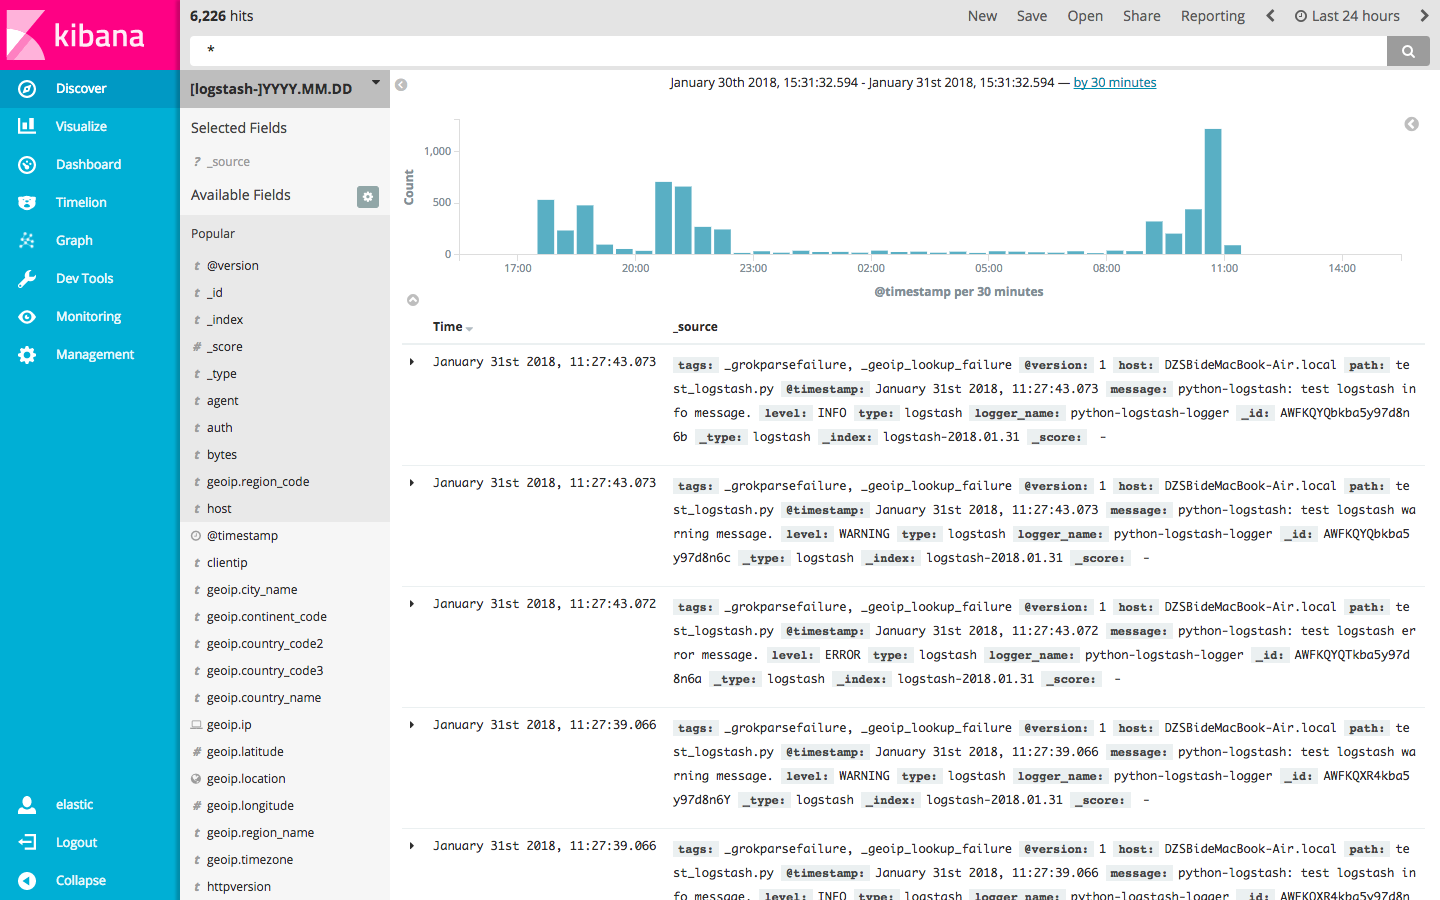
4、 直接写入Logstash的python日志表格式
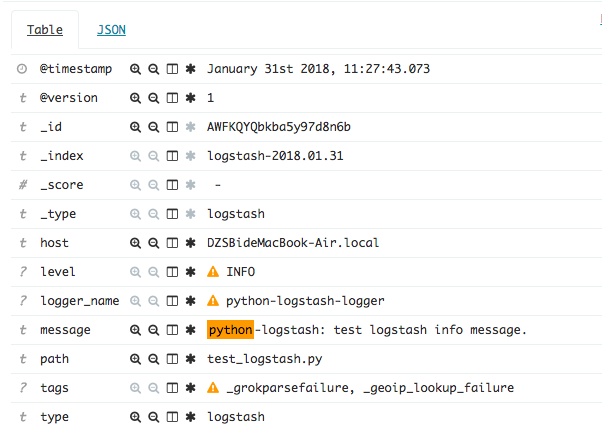
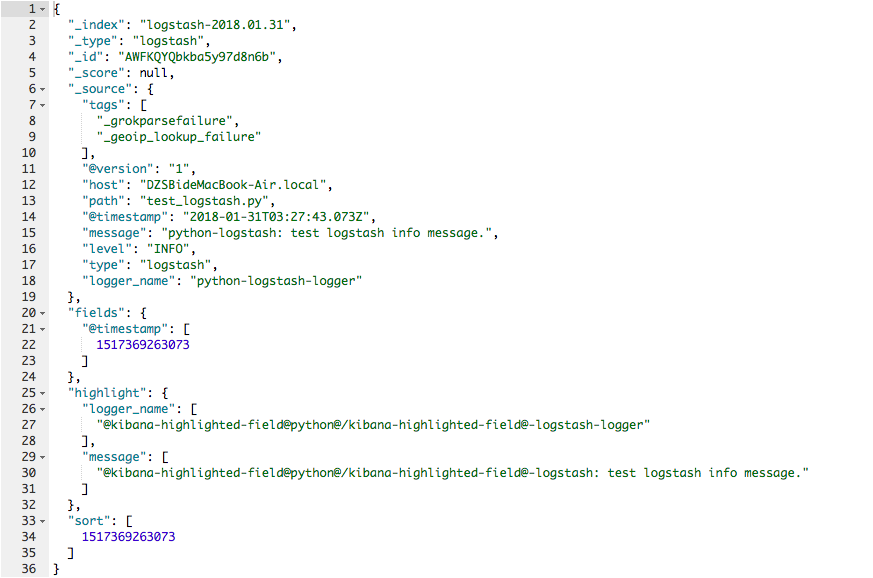
5、 直接写入Logstash的python日志json格式
远程日志收集
1、 filebeat 的安装
$ curl -L -O https://download.elastic.co/beats/filebeat/filebeat_1.3.0_amd64.deb
$ sudo dpkg -i filebeat_1.3.0_amd64.deb
$ sudo vim /etc/filebeat/filebeat.yml
filebeat:
  prospectors:
    -
      paths:
        - /var/log/nginx/*.log
        - /var/log/cashier/logs/*.log
        - /var/log/topen/logs/*.log
        - /var/log/xbasement/logs/*log
      input_type: log
      document_type: nginx-access-testapi.transfereasy.com
  registry_file: /var/lib/filebeat/registry
output:
  logstash:
          hosts: ["xxx.xx.xxx.xx:5959"]
shipper:
logging:
  files:
2、 将数据同步到elk
$ sudo /etc/init.d/filebeat start
$ sudo /etc/init.d/filebeat status